Soybean Traders: Unlock the Power of Spread Trading! Slash Volatility & Ride the 93% Seasonal Win Rate of this Spread! Ready to Learn This Game-Changer?
Soybean futures prices on a monthly nearby chart have been in a significant downtrend since February 2022, when prices retested the all-time high price, 1789'0 made in September 2012.
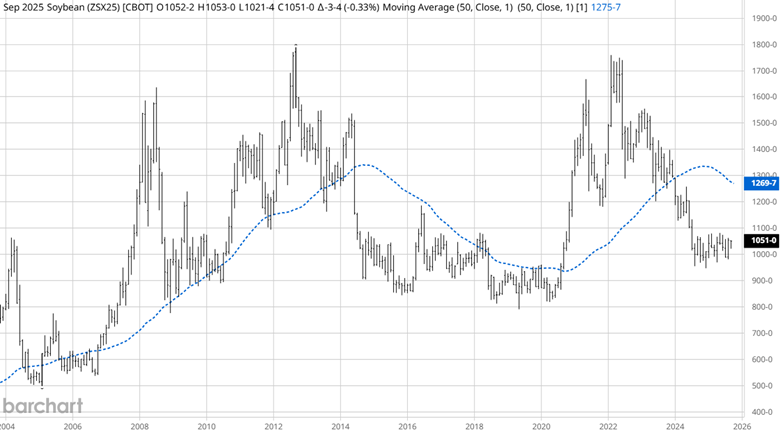
Source: Barchart
It's not unusual for market volatility to significantly increase when trading at or near all-time highs. Even today, although the market is trading in a basing pattern, the average daily range for November soybeans is about 15'0 per day or $750. Traders are always trying to reduce risk by trading instruments with different products. For example, options can be used to reduce volatility. Unfortunately, they can be overwhelming to a novice trader unfamiliar with all the Greeks involved in trading them. Another choice futures traders have is called spread trading. A November calendar spread of 2025 / 2026 currently has an average daily range of 5'0 per day or $250. This reduced volatility leads to less risk and more consistent trend moves than outright futures positions.
Here is a basic primer for the November Soybean 2025/2026 calendar spread:
Traders would buy 2026 November soybean futures and simultaneously sell 2025 November soybean futures to execute a calendar spread strategy, likely in anticipation of a wider price difference between the contracts. Spreads can be traded with unique symbols, eliminating legging into spreads. The symbol on Barchart would be ZSX25-ZSX26. This specific strategy is a form of spread trading that profits from the relationship between different delivery months of the same commodity, rather than betting on the outright direction of the commodity's price, allowing for more opportunities to be correct on the position.
Here's a breakdown of the strategy and the rationale behind it:
- The trade is a calendar spread: A trader takes opposite positions in futures contracts for the same commodity, but with different expiration months. Buying the longer-term contract (November 2026) and selling the shorter-term one (November 2025) is a bullish strategy on the spread itself.
- The profit driver is the price difference (the spread): The trader is not betting on whether soybean prices will rise or fall. Instead, they are speculating that the 2026 contract will increase relative to the price of the 2025 contract, or that the spread will widen. They profit when the 2026 contract gains on the 2025 contract.
- Reduced directional risk: By trading the spread, a trader significantly reduces their exposure to overall price movements in soybeans. If soybean prices drop across the board, the loss on the long 2026 contract may be offset by the gain on the short 2025 contract, assuming the spread moves as anticipated.
Market Fundamentals that Influence this Strategy
A trader would enter this calendar spread based on a fundamental market belief about future supply and demand.
Why a trader would expect the spread to widen:
- Anticipation of a supply shortage beyond the near term: The 2025 harvest, represented by the November 2025 contract, may appear plentiful and lead to depressed nearby prices. However, a trader could be concerned about a potential supply issue in the 2026 growing season. Factors like weather concerns in major growing regions such as South America could drive up expectations for the 2026 contract relative to 2025.
- Strong future demand: The trader may foresee an increase in demand from key importers, like China, that will be felt more strongly in 2026 than in 2025. This increased forward demand would pressure the deferred 2026 contract price upward.
- Contango and carry costs: Futures markets can trade in a "contango" state where longer-dated contracts (2026) are more expensive than shorter-dated (2025). Reflecting the costs of carrying (storing) the physical commodity over time. A trader may believe that market fundamentals, including carry costs, will push the 2026 contract price higher relative to 2025. They are betting that this price relationship will strengthen over time.
How the Trade Works:
- Entering the position: The trader buys the November 2026 soybean futures contract and simultaneously sells the November 2025 soybean futures. Currently, the spread is priced at -38'0. The margin to trade the outright positions would be approximately $3,500. However, trading the spread reduces the risk and margin required to trade both contracts to $950.
- Profiting from the widening spread: The trader will make money if the price of the 2026 contract rises more (or falls less) than the 2025 contract. For example, if the 2026 contract increases by $0.10 while the 2025 contract only rises by $0.05, the spread has widened, and the trader makes a profit on the difference.
- Losing on a narrowing spread: The trader will lose money if the spread narrows, and the 2025 contract gains on the 2026 contract. For example, if the 2025 contract falls by $0.10 while the 2026 contract falls by $0.15, the spread has narrowed, and the trade loses money.
Seasonal Spread Pattern
Historically, seasonal spread patterns have been more reliable than outright seasonal patterns. This is why floor traders considered spread trading the best-kept secret.
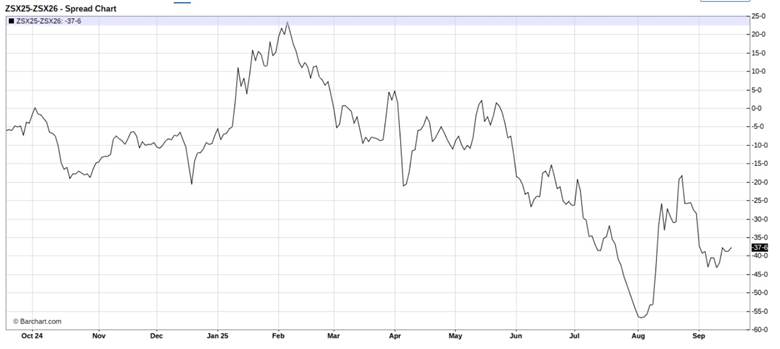
Source: Barchart
The daily line-on-close (LOC) chart only plots the daily close and shows the downtrend of the spread since the beginning of the year. To profit from this spread trade, the spread trend must remain down, regardless of the direction of the outright soybean prices.
Moore Research Center, Inc. (MRCI) produces annual special reports on various markets. This seasonal spread strategy came from their MRCI Historical Soybean Complex report.
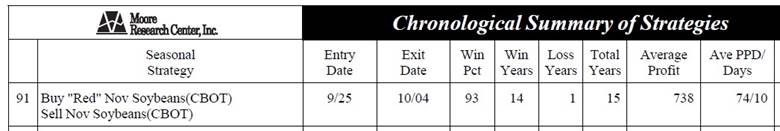
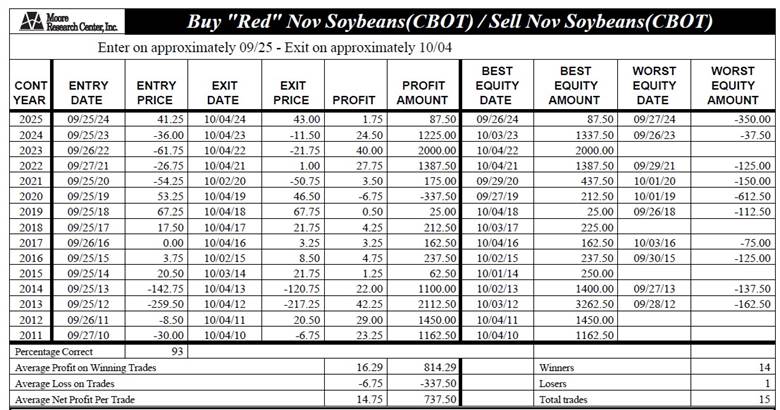
Source: MRCI
You will notice the term "Red" Nov Soybeans in the above strategy. Red means that the November 2025 soybean contract is still active, and the November 2026 contract is one year out.
Through extensive research, MRCI has found that buying the Red 2026 November soybean futures and selling the November 2025 soybean futures has resulted in a lower close on October 04 than on September 25 for 14 of the past 15 years, a 93% occurrence rate. In hypothetical trading, the net results have been 14'6 or $737.50 per spread, and during this period, 5 of the 15 years had no daily closing drawdown. Unlike an outright soybean futures contract, the worst daily equity drawdown was $612.50.This is considerably less than what an outright position would have been.
Source: MRCI
As a crucial reminder, while seasonal patterns can provide valuable insights, they should not be the basis for trading decisions. Traders must consider various technical and fundamental indicators, risk management strategies, and market conditions to make informed and balanced trading decisions.
In closing…
As the grain markets approach the harvest season, soybean futures are poised for potential price shifts, with historical seasonal patterns indicating increased volatility. As highlighted, the November 2025/2026 soybean calendar spread showcases a reliable downtrend, with a 93% occurrence rate of a lower close between September 25 and October 4 over the past 15 years. This seasonal consistency, driven by market fundamentals like supply concerns or future demand expectations, underscores the value of spread trading. Traders can capitalize on these reliable patterns without betting on the outright direction of soybean prices, leveraging the spread's historical tendency to widen or narrow to navigate the market's seasonal dynamics effectively.
Spread trading, as demonstrated with the November 2025/2026 soybean calendar spread, offers significant opportunities for traders seeking to manage risk and capital efficiently. Reducing volatility—cutting the average daily range from $750 in outright futures to $250 in the spread—and lowering margin requirements from $3,500 to $950 minimizes exposure while maintaining profit potential. With the harvest season upon us, price trends in the grain markets will likely shift, making spread trading an essential tool for traders. Understanding and applying such strategies enhances market participation and equips traders with a disciplined approach to capitalize on seasonal opportunities while reducing risk.
On the date of publication, Don Dawson did not have (either directly or indirectly) positions in any of the securities mentioned in this article. All information and data in this article is solely for informational purposes. For more information please view the Barchart Disclosure Policy here.